
Mastering email marketing takes time and effort. You need to follow best practices for each campaign, avoid common mistakes beginners make, and optimize your emails to boost engagement.
However, just doing those things won’t guarantee success. You also need to understand how to measure your results.
The metrics for evaluating email marketing are constantly evolving, too. When new things like Apple’s Mail Privacy Protection launch, it can change how we define success in email marketing. So staying current is crucial.
Before diving too deep into everything email marketing entails, take a step back. Figure out your goals for email marketing, then decide how you’ll measure whether you achieved them.
Each email campaign can have different goals, like generating leads or growing your list. But there are basic metrics every email marketer should know how to track.
Which of the following metric is used for tracking the status of email marketing?
Open rate
Open rate is one of the most straightforward and commonly used metrics by email marketers. It tracks the percentage of subscribers who open a particular email, providing insight into subscriber engagement and subject line effectiveness.
However, when Apple’s Mail Privacy Protection is publicly available, it will effectively disable open tracking for users who opt-in. As more inbox providers follow suit, open rate will become increasingly unreliable as a metric.
Click-through rate (CTR)
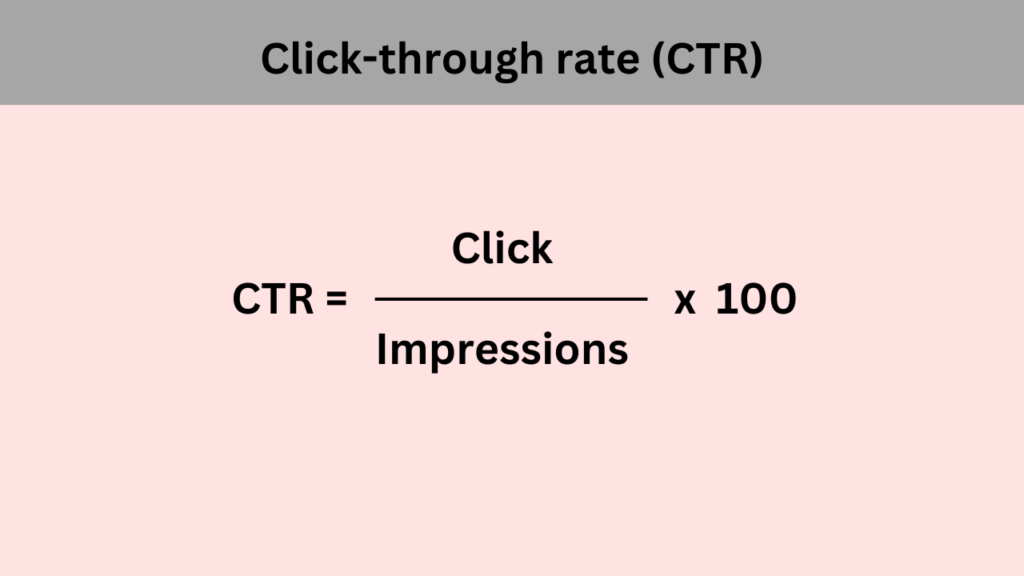
CTR is another prevalent metric that helps determine campaign performance. CTR measures the percentage of people who clicked the links in an email. For instance, if a link to redeem an offer was included, CTR would show the percentage of subscribers who clicked it.
Some ways to increase CTR are including links throughout the email where appropriate and having a noticeable call-to-action button for the offer that subscribers can click.
CTR is usually much lower than open rate. The average CTR for most campaigns is a little over 2%.
Conversion rate
While CTR shows how many people clicked a link, conversion rate evaluates how many people clicked the link and completed a desired action. For example, if a Black Friday sale link was in an email, the conversion rate would indicate the percentage of clickers who made a purchase.
Conversion rates provide unique insight into return on investment. Knowing the cost and number of converting subscribers makes it easier to determine if the campaign money is paying off.
Bounce Rate
When you send out an email campaign, you’ll also want to keep track of the bounce rate, which measures the percentage of subscriber emails that didn’t receive your message. Soft bounces indicate temporary issues with email addresses, while hard bounces show permanent problems.
Comparing bounce rates to open rates gives you a solid sense of your subscriber list quality. A high hard bounce percentage could mean you have a lot of fake, old, or incorrect addresses.
Requiring double opt-in, which asks subscribers to confirm their email address and consent, can preemptively reduce bounce rates. Double opt-in helps ensure higher quality lists and fewer bounces.
Number of Unsubscribes
Tracking unsubscribes is straightforward – your email provider will show how many people opted out of your emails. This metric is usually visible on your main or metrics dashboard.
A high unsubscribe rate can be discouraging. However, email marketers often view unsubscribes positively, as they help refine your subscriber list.
Giving subscribers a clear unsubscribe option also builds trust by letting them control the content they receive.
List Growth Rate
List growth rate measures how quickly your list is expanding.
You can calculate it by taking new subscribers minus unsubscribes, dividing by total list size, and multiplying by 100.
Some attrition is natural, so focus on continually growing your list, engaging subscribers, and attracting loyal followers.
Spam complaints
Receiving spam complaints about your emails can be very disheartening. Although you may want to disregard these instances, it’s important to pay attention to spam complaints.
Email service providers want to maintain quality and track spam complaints. If this rate becomes too high, your email service provider may take action against you by blocking your account.
Your email service provider will likely monitor this number for you, but you may want to keep an eye on it yourself to ensure nothing is technically wrong with your emails and that your copywriting meets your standards. Avoiding spam filters is crucial for maximizing the opens, clicks, and conversions you get from your email campaigns.
Forwarding rate/email sharing
The forwarding rate or email sharing rate measures the percentage of recipients who shared your email via social media or forwarded it to a friend.
Tracking the forwarding rate is helpful because it gives you an idea of how many brand advocates you have. It shows you what percentage of subscribers are recommending your emails to others.
Developing brand advocates through email marketing is an excellent strategy, especially considering 81% of consumers’ purchasing decisions are influenced by friends’ social media posts.
Engagement over time
Tracking engagement over time will provide information on the optimal times to send messages.
You can use automation in your email service provider to send emails based on customer behavior or triggers, but monitoring engagement over time will show you when you get the highest click rates for non-automated emails.
Some email service providers automatically gather this data for you. However, it’s beneficial to track this metric yourself to determine the best send times for your industry and subscribers.
Overall ROI
The overall return on investment (ROI) is a key email metric every marketer should monitor. It shows the total ROI for your campaigns.
To calculate it, take the revenue generated from sales of the campaign and subtract the costs of running the campaign. Then divide that by the money invested in the campaign and multiply by 100.
Email marketing can require investment, but it also has the highest ROI among all digital marketing approaches.
Email sharing rate
The email sharing rate shows how often a recipient shared your email through social media. It does not include sharing through email.
This metric comes from the “share this” button on your email. To find the rate, divide the total “share this” clicks by the number of emails delivered, then multiply by 100.
This stat also lets you establish helpful email benchmarks.
Mobile open rate
This metric works the same as the regular open rate, but applies only to mobile devices like phones and tablets.
Unlike desktop open rates, which often occur on weekdays when people are working, mobile open rates are more common on weekends.
However, Apple’s Mail Privacy Protection also affects this metric. MPP blocks our ability to see the device or operating system used, so we can no longer distinguish desktop versus mobile opens for users who enable MPP.
Mobile click rate
Mobile click rates function the same as desktop click rates, but relate to mobile devices including phones and tablets.
Mobile click rates tend to be much lower than desktop click rates because users often use multiple windows and other complex browsing behaviors, which are easier on a desktop than a phone.
Similar to mobile open rate, mobile click rate will be impacted by MPP. However, if your main goal is to reach your audience on their mobile device, weekends are typically the best time to do so.
Domain open rate
This rate is very important to ensure email deliverability success, making it one of the most vital email marketing metrics.
This rate allows you to see the percentage of people opening your emails on a specific email provider. In doing so, you may be able to identify issues with a domain’s spam filter.
Again, you won’t be able to accurately track this for Apple Mail users, but it will still work for those not opting into MPP.
Domain click rate
Like domain open rate, this will let you see how many people are clicking your emails within a given email provider.
This metric will help you identify any problems with an email domain’s spam policy by comparing click rates between providers. All you need to do is find the average click rate across all providers, then compare to the individual providers.
Revenue per email
Analyzing the revenue generated per individual email campaign provides insight into which emails are most successful at driving revenue. This metric allows you to easily identify your top performing and underperforming email campaigns. Focusing on key metrics like clicks, website traffic, and conversions provides the data needed to track the ROI of each email campaign.
Revenue per subscriber
Calculating revenue per subscriber is another way to analyze email marketing ROI at a more granular level. While revenue per email looks at campaign performance, revenue per subscriber evaluates which customer segments are generating the most revenue.
This enables you to determine which demographics to target or deprioritize, and to allocate resources accordingly. It also reveals opportunities to refine email content and strategy for certain segments to improve results.
Read Also: How Can You Personalize Email Campaigns To Increase Engagement?
What narrative is being conveyed by your data?
Your email data can reveal important insights about your customers and how to enhance your email marketing strategy. By analyzing email metrics, you can identify trends, opportunities, and potential issues. Consider these questions when reviewing your data:
- Did one email drastically outperform or underperform others in open rates? With few exceptions, open rates should be fairly consistent. If a certain email type is significantly overperforming, it indicates your subscribers have high interest in that content.
- Are open rates shifting based on factors like timing or frequency? The day, time, and frequency you send emails can directly impact open rates. If a specific time gets higher open rates, send more emails then. If rates decline when sending emails too close together, space out your frequency.
- Do click-through rates vary by content type? Click-throughs show if your content is driving traffic. If certain content like new product announcements perform better than tips, your subscribers likely want to hear about new offerings.
Email marketing allows ongoing engagement with your audience to build loyalty. By analyzing key metrics like these examples, you’ll gain insights into what content resonates. Use these findings to refine your strategy and boost email success.
Conclusion
In conclusion, understanding the top 17 email marketing metrics is essential for every marketer. While some of these metrics are evolving, they all remain crucial for assessing the performance of email campaigns. When evaluating your email campaigns, prioritize metrics that consistently provide valuable data for guiding your email campaigns, offer insights into user behaviors, and keep your team aligned with campaign objectives.
By setting campaign goals and comparing these email metrics to industry standards, you can effectively measure your overall success and identify areas for strategy adjustments.